

Loading…
Supply, pace and competition in Kitchener, measured from my Toronto Regional Real Estate Board feed. Sold prices and bidding sit behind VIP Listings Access, as the board requires.
Sales figures for August 2026, the last complete month. Listing counts are current as at Sep 19, 2026, compiled from the Toronto Regional Real Estate Board feed.
Months of inventory is the clearest single read on who has leverage — it's how long the current supply would take to clear at the current pace of sales.
2.8
How long today's listings would take to sell at the current pace. Above 4.5 favours buyers; below 2.8 favours sellers.
20 days
How long a typical home took to sell, from the sales that closed in the month above. Excludes listings withdrawn without selling.
592
Homes available in this market as at the date above — this one is current, not monthly.
364
-11.9% year over year
Brought to market in the month above, whether or not they are still available.
Sold prices, bidding and history come from closed transactions, which my board releases only under a Virtual Office Website agreement — to registered clients.
12 months · lower means faster sales
| Month | Days on market |
|---|---|
| Sep | 18d |
| Oct | 20d |
| Nov | 24d |
| Dec | 25d |
| Jan | 28d |
| Feb | 25d |
| Mar | 21d |
| Apr | 20d |
| May | 19d |
| Jun | 15d |
| Jul | 18d |
| Aug | 20d |
Share of the four main home types currently listed
 Waterloo (photograph is representative of the area, not of this town)
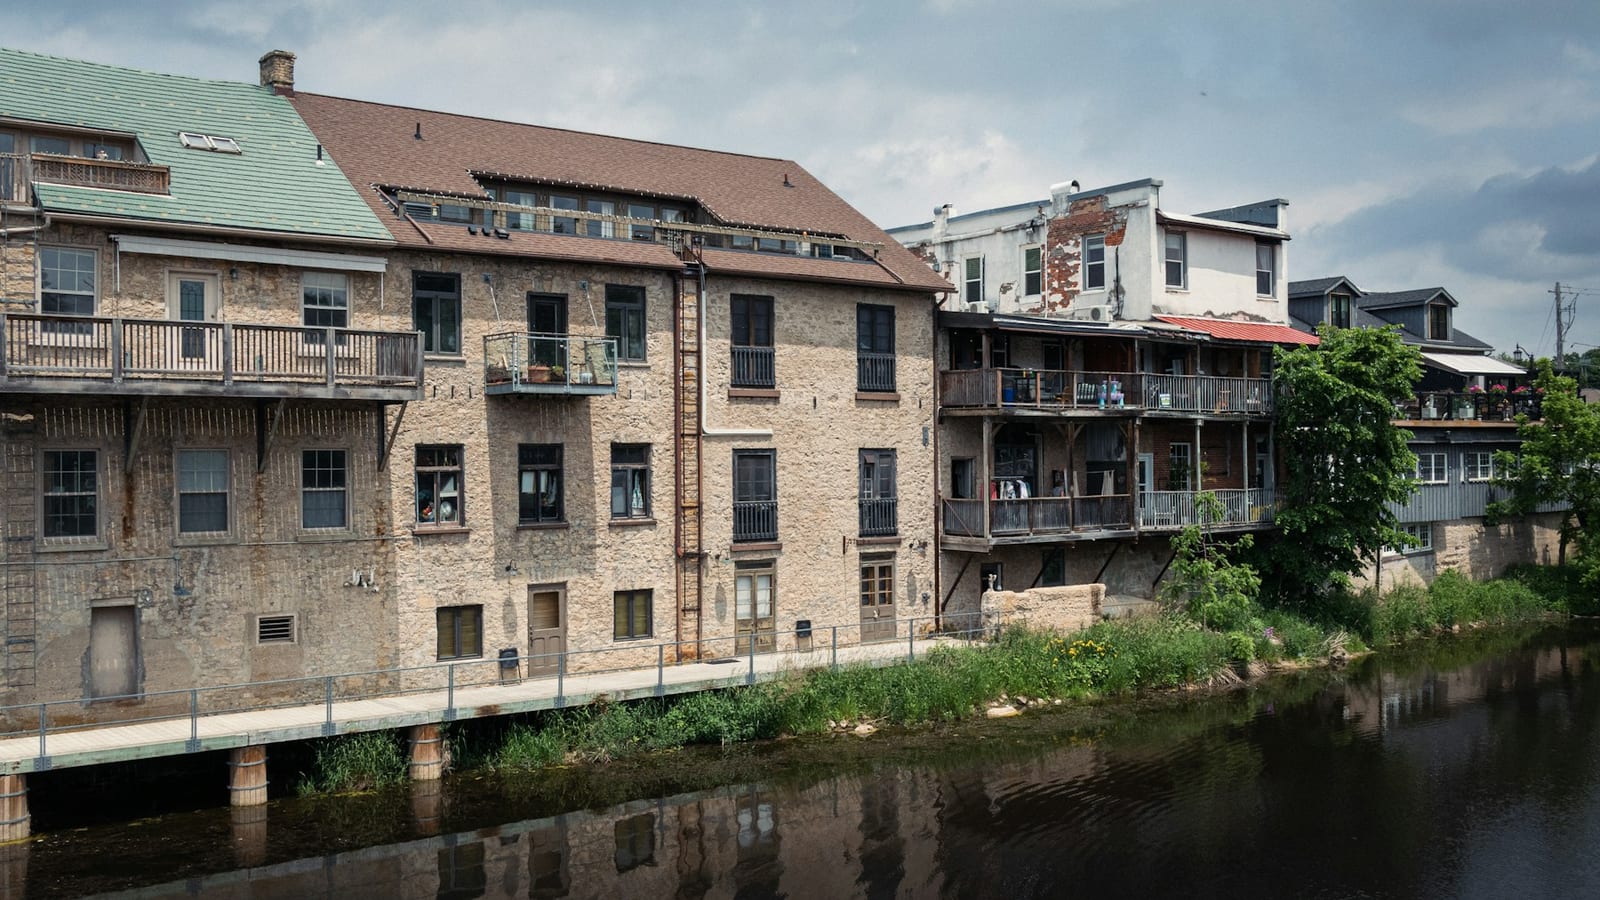 Cambridge (photograph is representative of the area, not of this town)
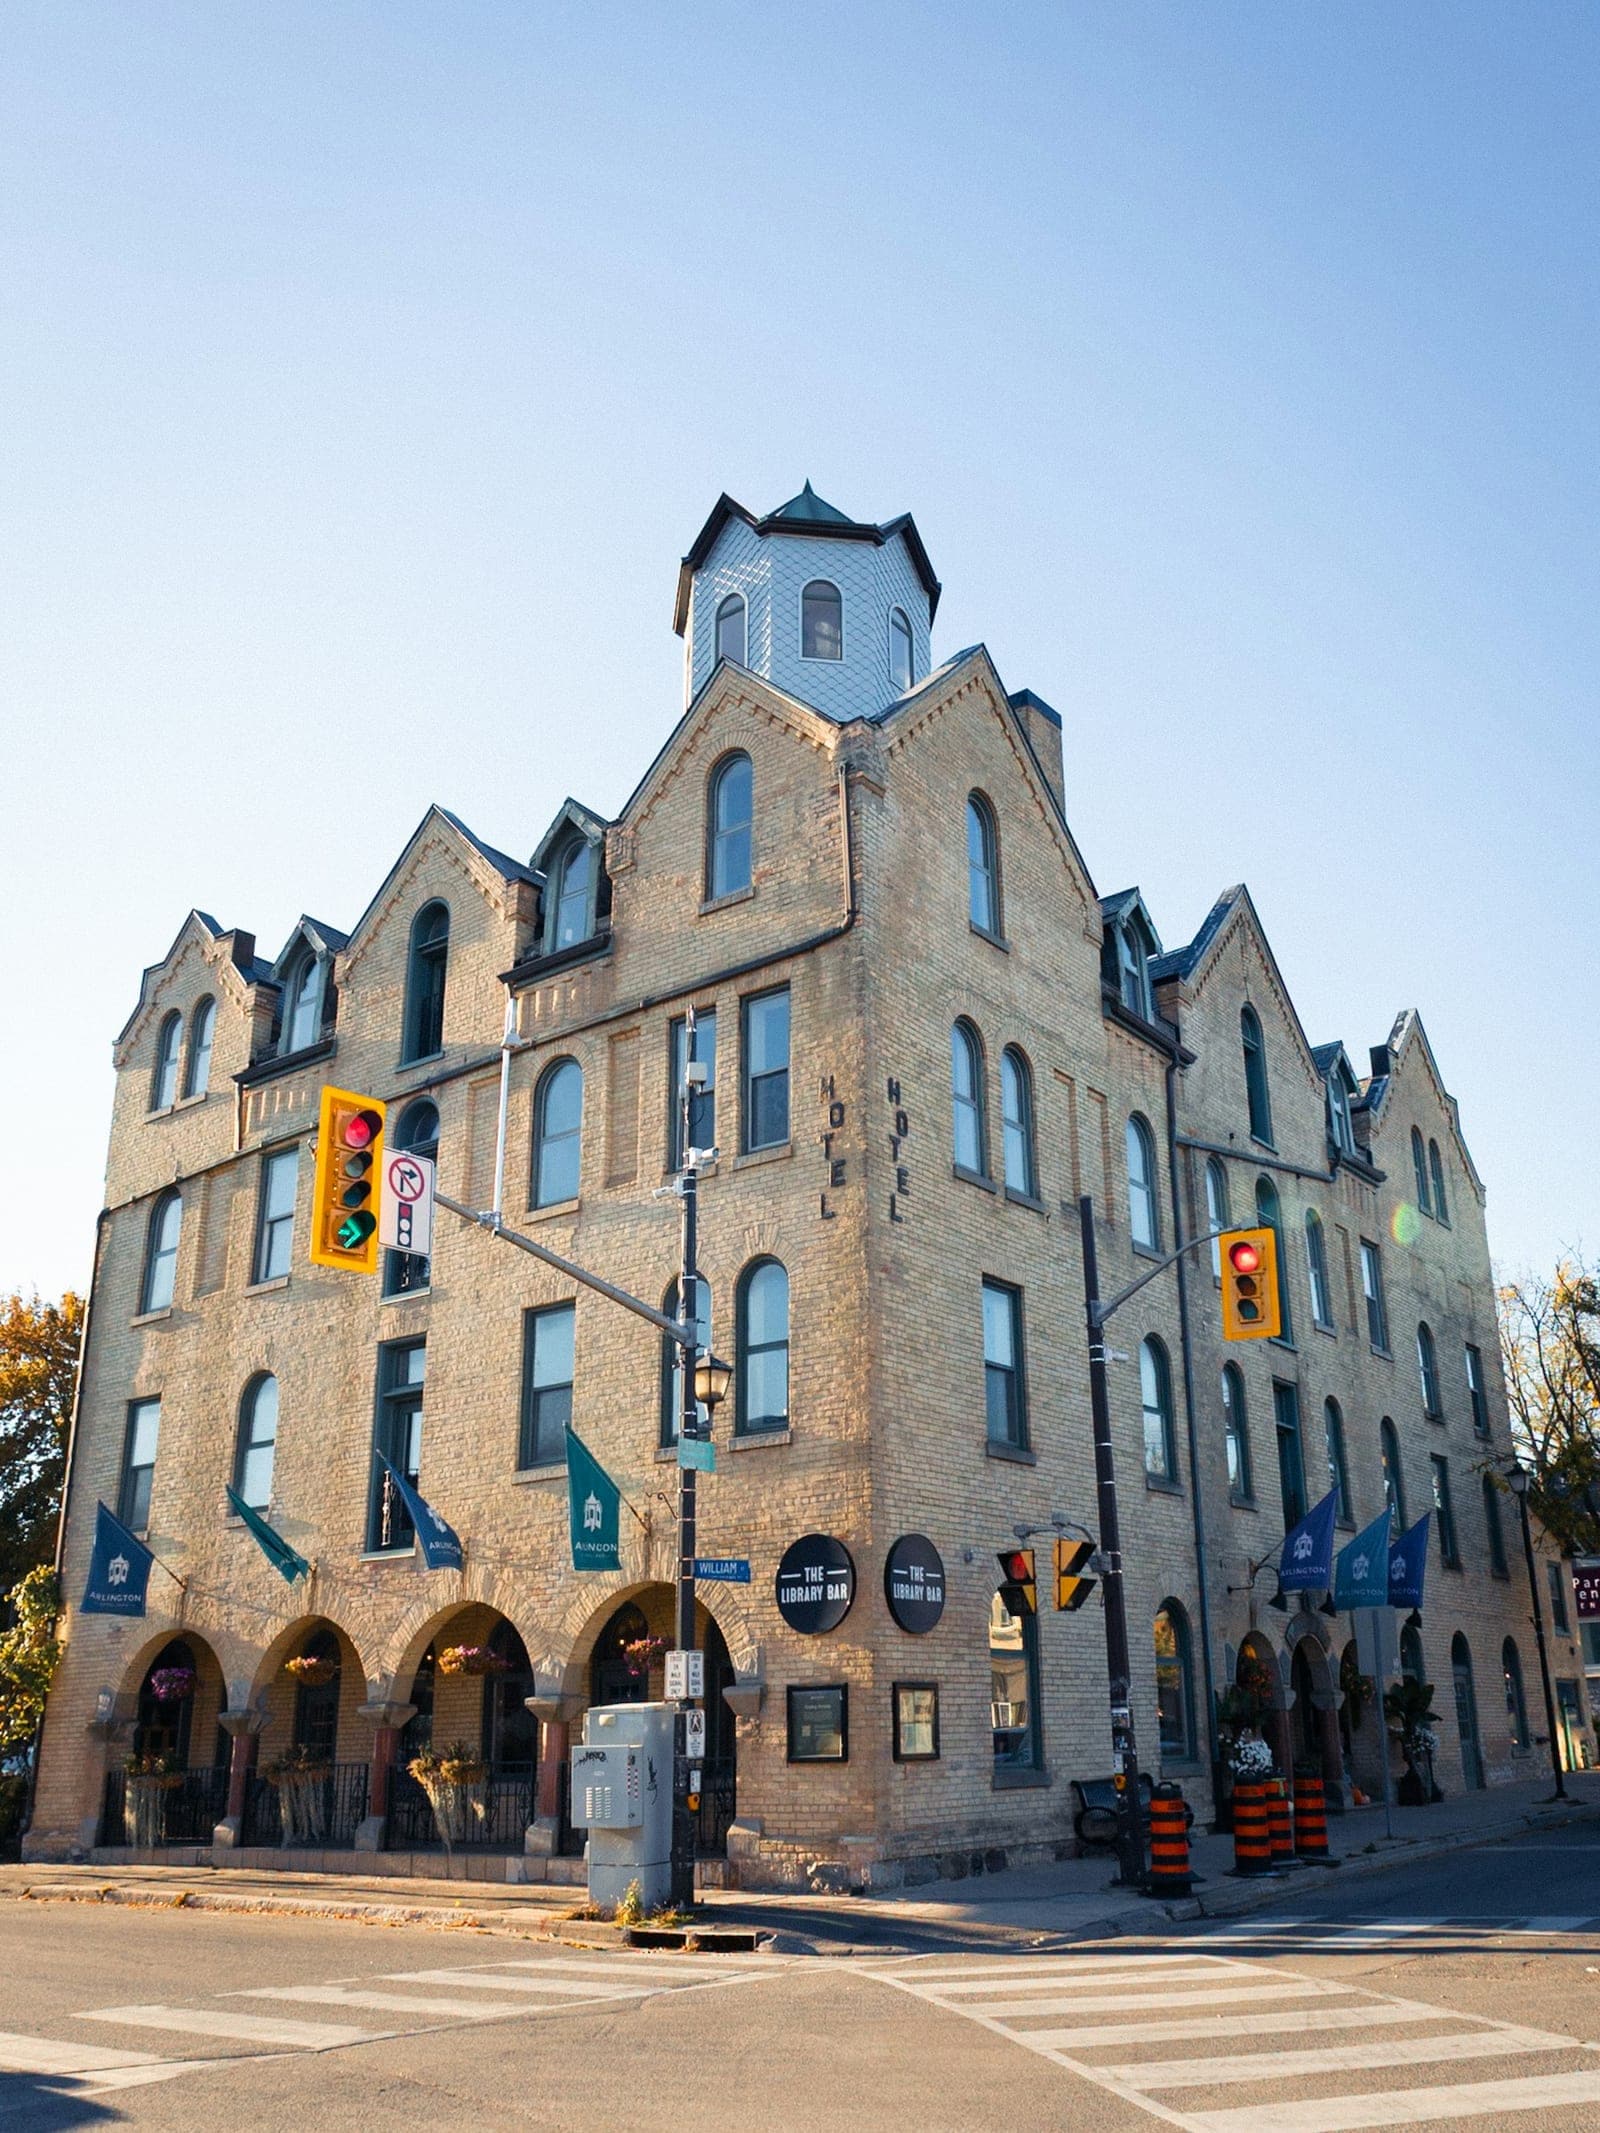 Guelph (photograph is representative of the area, not of this town)
 Brantford (photograph is representative of the area, not of this town)
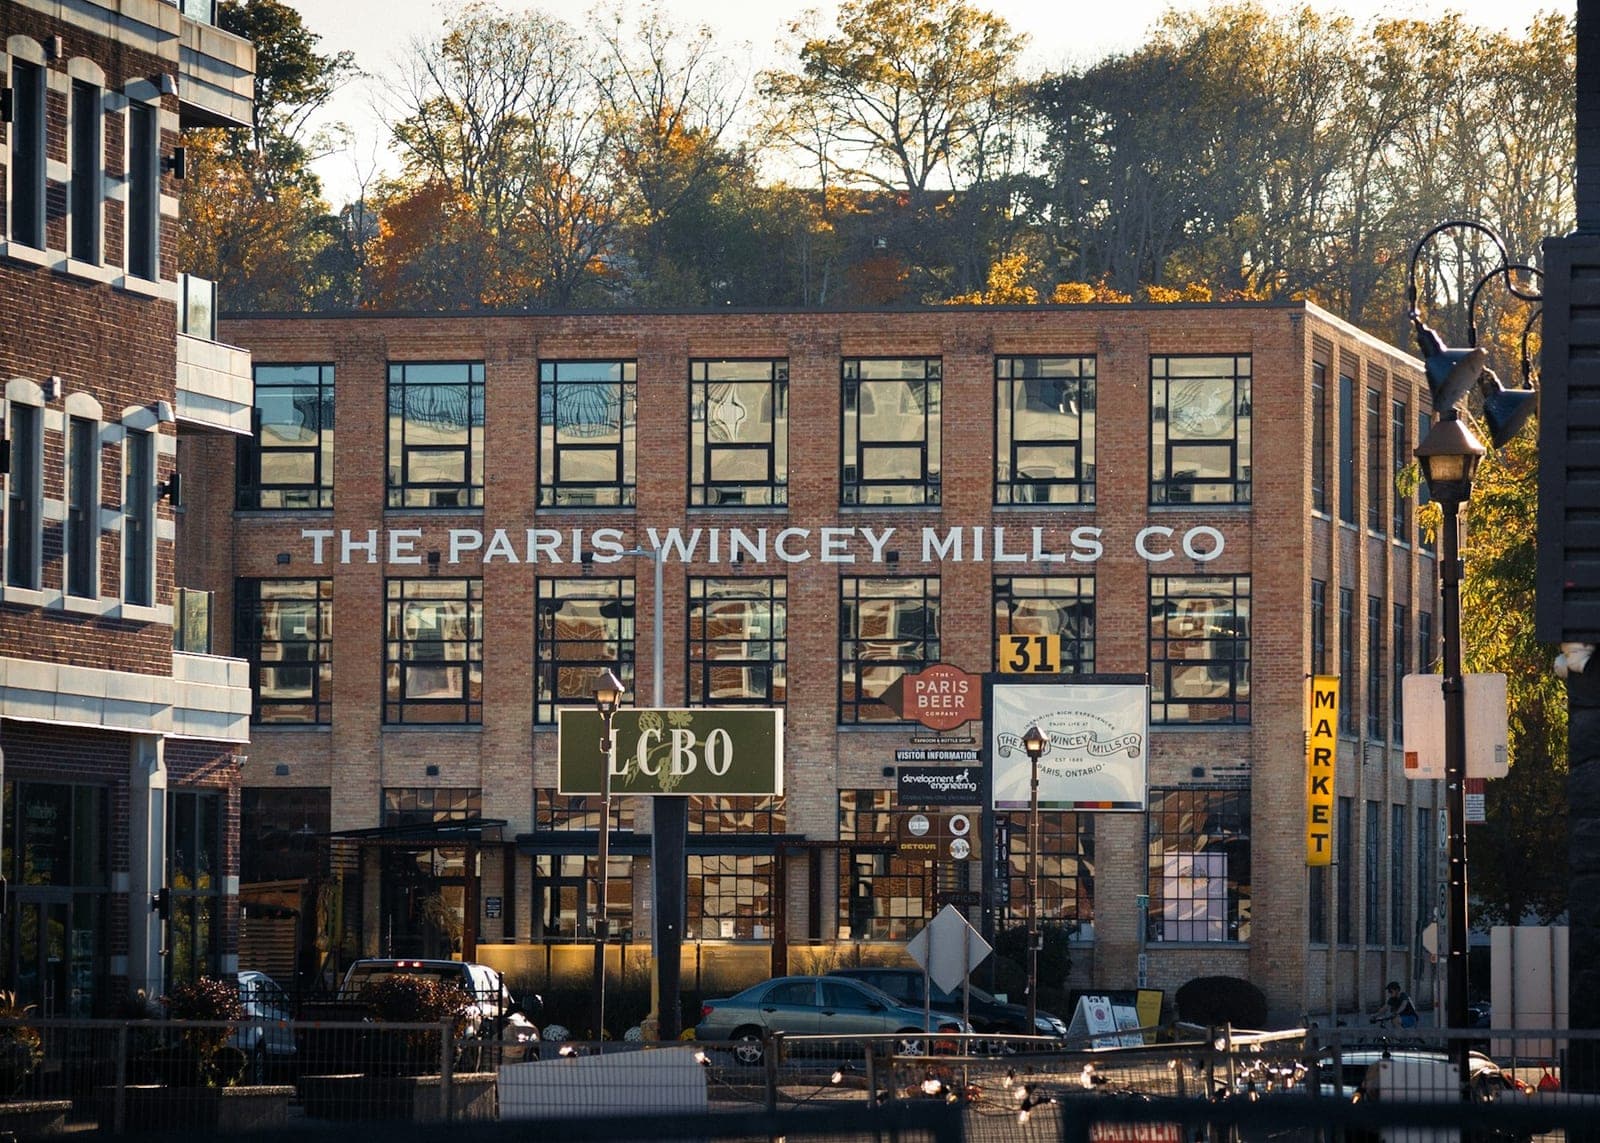 Woodstock (photograph is representative of the area, not of this town)
Buying, selling, or just trying to work out whether the timing makes sense — a short call costs you nothing and usually makes the decision a lot clearer.